GPU Server Power Consumption: Calculating and Optimizing Energy Costs
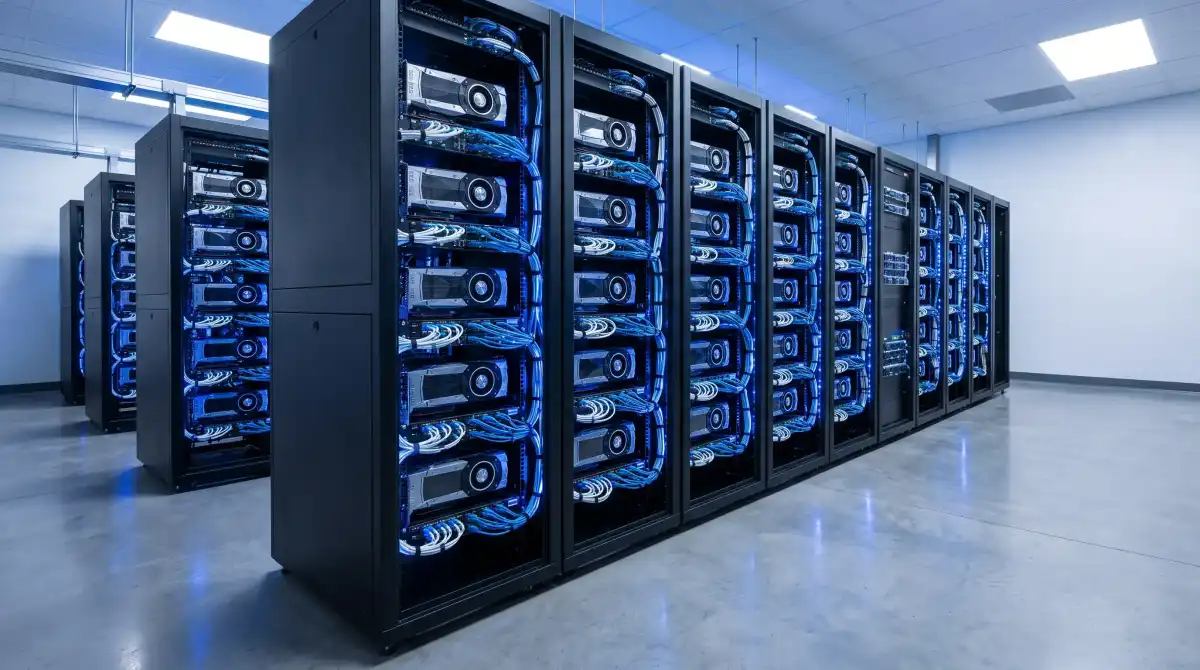
Power is the single largest operating cost for GPU-intensive AI infrastructure. An 8-GPU H100 server consumes more electricity than most residential homes. A 1,000-GPU training cluster draws enough power to supply a small town. Understanding exactly how much power your GPU servers consume -- not the spec-sheet number, but the real-world figure under your actual workloads -- is the difference between accurate cost projections and budget surprises that compound every month.
This guide walks through GPU server power consumption from first principles: what determines power draw, how to calculate it accurately for capacity planning and cost estimation, where the hidden overhead costs live, and how to optimize energy costs without sacrificing compute performance.
GPU Power Fundamentals: TDP vs. Real-World Draw
What TDP Actually Means
Thermal Design Power (TDP) is the maximum amount of heat a GPU is designed to generate under sustained worst-case workloads. It is not a power consumption specification per se -- it is a thermal specification that tells cooling system designers how much heat they need to dissipate. However, because power in equals heat out (first law of thermodynamics, conservation of energy), TDP is effectively the maximum sustained power draw.
Key nuance: TDP is a sustained maximum, not an absolute maximum. GPUs can briefly exceed TDP during power spikes (transient load steps), which is why PDU sizing and circuit breaker selection must account for inrush currents and transient peaks that may exceed TDP by 20-30% for millisecond durations.
Current GPU TDP Specifications
| GPU Model | TDP (W) | Typical Training Draw | Typical Inference Draw | Idle (W) |
|---|---|---|---|---|
| NVIDIA H100 SXM | 700 | 650-700 | 300-500 | 30-45 |
| NVIDIA H100 PCIe | 350 | 320-350 | 150-250 | 25-35 |
| NVIDIA H200 SXM | 700 | 650-700 | 280-480 | 30-45 |
| NVIDIA A100 SXM (80GB) | 400 | 370-400 | 180-300 | 25-35 |
| NVIDIA B200 SXM | 1000 | 900-1000 | 400-650 | 40-55 |
| NVIDIA GB200 (Grace Blackwell) | 1200 | 1050-1200 | 450-700 | 50-65 |
| AMD MI300X | 750 | 680-750 | 320-520 | 35-50 |
| NVIDIA RTX 4090 | 450 | 380-450 | 150-280 | 15-25 |
| NVIDIA RTX 5090 | 575 | 500-575 | 200-380 | 20-30 |
The gap between TDP and actual draw matters for cost modeling. Using TDP directly for electricity cost calculations overestimates costs by 5-15% for training workloads and 30-60% for inference workloads. Using average draw for PDU and breaker sizing underestimates requirements and risks tripping breakers during peak loads.
Calculating Total Server Power
Server-Level Power Components
A GPU server's total power consumption is not just the GPUs. Every component draws power, and the non-GPU components add 15-40% overhead depending on the server configuration:
- GPUs: 60-75% of total server power. Calculated above.
- CPUs: 150-350W per socket. Most GPU servers use dual-socket configurations (AMD EPYC 9004 series at 280-360W TDP per socket, or Intel Xeon Sapphire Rapids at 250-350W). Total CPU contribution: 300-720W per server.
- Memory (DRAM): 5-12W per DIMM. A server with 2TB of DDR5 across 32 DIMMs draws 160-384W for memory alone. High-memory configurations (4TB+) can exceed 500W for DRAM.
- NVLink/NVSwitch: NVIDIA DGX-class servers with NVSwitch fabric add 200-400W for the NVLink interconnect between GPUs. This is not present in PCIe-based servers.
- Networking: ConnectX-7 NICs at 20-30W each, 2-4 per server = 40-120W. InfiniBand HCAs draw 15-25W each.
- Storage: NVMe SSDs at 7-15W each, 2-8 per server = 14-120W. Servers with large local storage arrays consume more.
- Fans: 50-200W depending on airflow requirements and ambient temperature. Higher in hot climates (relevant for UAE deployments) unless using liquid cooling.
- PSU losses: Power supply units are 92-96% efficient (80+ Platinum/Titanium). At 10 kW IT load, PSU losses add 400-800W.
Example: 8x H100 SXM Server (DGX H100 class)
GPUs: 8 x 700W = 5,600W (TDP) / 5,200W (typical training)
CPUs: 2 x 350W = 700W
Memory: 32 DIMMs x 10W = 320W
NVSwitch: 300W
Networking: 4 NICs x 25W = 100W
Storage: 4 NVMe x 10W = 40W
Fans: 150W
PSU loss (5%): ~355W
Total server at TDP: ~7,565W (7.6 kW)
Total server typical training: ~7,165W (7.2 kW)
Rack-Level Power
Modern GPU servers are dense. A standard 42U rack can hold 4-8 GPU servers depending on form factor. Rack-level power considerations:
- Per-rack IT load: 4 DGX-class servers at 7.5 kW each = 30 kW per rack. 8 servers in a dense configuration = 60 kW per rack. Some next-generation GPU racks exceed 100 kW.
- PDU overhead: Rack PDUs consume 1-3% of passthrough power for monitoring and switching. At 30 kW, this adds 300-900W.
- Top-of-rack switching: Network switches (Mellanox SN5600, Arista 7060X) draw 300-600W each, typically 2 per rack = 600-1,200W.
A typical 4-server GPU rack therefore draws 31-33 kW of IT power. With an 8-server dense configuration, you are looking at 62-66 kW per rack. This is 5-10x the power density of a traditional enterprise server rack (5-8 kW). Your colocation provider must support this density, which is why high-density colocation is a specialized service, not a standard offering.
Facility Overhead: PUE and Total Power Cost
Understanding PUE
Power Usage Effectiveness (PUE) measures the ratio of total facility power to IT equipment power. A PUE of 1.0 would mean every watt entering the facility powers IT equipment (physically impossible). Real-world PUE depends on cooling technology, climate, and facility design:
| Cooling Technology | Typical PUE | Overhead per kW IT Load |
|---|---|---|
| Traditional air cooling (hot climate) | 1.5-1.8 | 500-800W |
| Optimized air cooling (cool climate) | 1.2-1.4 | 200-400W |
| Rear-door heat exchangers | 1.15-1.25 | 150-250W |
| Direct-to-chip liquid cooling | 1.03-1.10 | 30-100W |
| Immersion cooling | 1.02-1.06 | 20-60W |
In the UAE, where ambient temperatures regularly exceed 45C (113F), air-cooled facilities pay a significant PUE penalty. A data center that achieves PUE 1.3 in Scandinavia might see PUE 1.6+ in Dubai with the same design. This is why liquid cooling is not a luxury for Gulf region GPU deployments -- it is an economic necessity. Direct-to-chip liquid cooling eliminates the climate dependency and delivers consistent PUE regardless of ambient temperature.
Total Cost of Power Formula
Monthly Electricity Cost Calculator
Monthly Cost = IT Load (kW) x PUE x 730 (hours/month) x Rate ($/kWh)
Example 1: Single DGX H100 server, training workload, liquid-cooled facility
7.2 kW x 1.05 PUE x 730 hrs x $0.06/kWh = $331/month
Example 2: Same server, air-cooled facility in hot climate
7.2 kW x 1.55 PUE x 730 hrs x $0.06/kWh = $489/month
Difference: $158/month per server, or $1,896/year.
At cluster scale (64 servers): liquid cooling saves $121,344/year in electricity alone.
Power Cost by GPU Architecture: Real-World Comparison
The following table compares monthly electricity cost per server for common GPU configurations, assuming 85% utilization (typical for dedicated training clusters), a PUE of 1.10 (liquid-cooled), and a blended rate of $0.055/kWh (competitive UAE colocation rate):
| Server Config | IT Load (kW) | With PUE (kW) | Monthly Cost | Cost per GPU/month |
|---|---|---|---|---|
| 8x H100 SXM (DGX H100) | 7.2 | 7.9 | $318 | $40 |
| 8x H200 SXM | 7.4 | 8.1 | $327 | $41 |
| 8x A100 SXM (80GB) | 4.8 | 5.3 | $214 | $27 |
| 8x B200 SXM | 10.8 | 11.9 | $480 | $60 |
| 8x GB200 (Grace Blackwell) | 12.5 | 13.8 | $557 | $70 |
| 8x MI300X | 8.0 | 8.8 | $355 | $44 |
| 8x RTX 4090 | 5.0 | 5.5 | $222 | $28 |
| 8x RTX 5090 | 6.2 | 6.8 | $275 | $34 |
The Blackwell generation (B200, GB200) represents a step-change in per-GPU power. While performance per watt improves with each generation, absolute power consumption is increasing. This has direct implications for facility infrastructure: a rack of GB200 servers may require 100+ kW of power delivery and cooling capacity, pushing beyond what many existing data centers can supply to a single rack.
Hidden Power Costs: What the Spec Sheet Misses
Training vs. Inference Power Profiles
Power consumption varies dramatically by workload type. Training is the most power-intensive operation because it requires continuous matrix multiplication across all GPU memory, sustained GPU-to-GPU communication via NVLink/NVSwitch, checkpoint writing to storage (periodic high-throughput bursts), and all GPUs running at maximum utilization simultaneously.
Inference is less power-intensive but more variable. Batch inference approaches training-level power draw (high GPU utilization). Real-time inference with variable request rates shows significant power fluctuation (GPU utilization spikes and drops). Small-model inference may never exceed 40% of GPU TDP.
Networking Power
Large GPU clusters require substantial networking infrastructure that adds to total power draw. For an InfiniBand fabric serving 256 GPUs (32 servers), top-of-rack switches (8 switches at 500W) draw 4 kW, spine switches (4 switches at 800W) draw 3.2 kW, and management network switches add 600W. Total networking power is approximately 7.8 kW, or roughly 3.4% of the cluster IT load. At 1,024 GPUs, networking power scales to 20-25 kW.
Storage Power
AI training clusters need high-throughput parallel storage. A Lustre or GPFS parallel filesystem serving 256 GPUs typically requires 8-16 storage servers at 500-800W each, plus JBODs (disk shelves) at 200-400W each. Total storage power for a 256-GPU cluster: 8-12 kW, or 3-5% of cluster IT power.
UPS Losses
Online double-conversion UPS systems have 92-96% efficiency. At 100 kW IT load, UPS losses add 4-8 kW of waste heat that also requires cooling. Modern high-efficiency UPS (>96% efficiency with ECO mode) reduces this overhead, but it is never zero. This overhead is already captured in PUE calculations but is worth understanding as a discrete cost driver.
Energy Cost Optimization Strategies
1. Right-Size Power Allocation
Many colocation contracts charge for reserved power capacity, not actual consumption. If you reserve 100 kW but average 65 kW draw, you are paying for 35 kW you do not use. Strategies to right-size:
- Monitor actual power draw for 30 days before committing to a contract power level.
- Negotiate metered power contracts (pay for actual draw + small capacity reservation fee) rather than flat power allocation contracts.
- Use GPU power capping (NVIDIA nvidia-smi -pl) to set maximum power limits per GPU, trading slight performance reduction (5-10%) for predictable, lower power draw.
2. GPU Power Capping
NVIDIA GPUs support software-configurable power limits. Setting an H100 from 700W TDP to 600W typically reduces performance by only 5-8% for training workloads while saving 14% on GPU power. The power-performance curve is non-linear: the last 10-15% of power delivers diminishing performance returns.
Power Capping ROI Example (64-GPU cluster)
Uncapped: 64 GPUs x 700W = 44.8 kW GPU power
Capped to 600W: 64 GPUs x 600W = 38.4 kW GPU power
Savings: 6.4 kW x 1.1 PUE x 730 hrs x $0.055/kWh = $283/month
Annual savings: $3,396 for a 5-8% training time increase.
At scale (1,024 GPUs): $54,336/year savings.
3. Workload-Aware Scheduling
Not all training operations require maximum power. Data preprocessing, checkpoint saving, evaluation passes, and hyperparameter search with early stopping all have lower GPU utilization than forward/backward pass computation. Slurm-based job schedulers can implement power-aware scheduling policies that pack low-power jobs together to maximize the number of active jobs within a fixed power budget.
4. Choose the Right GPU for the Workload
Running inference on H100 GPUs designed for training is like using a dump truck for grocery shopping. GPU selection should match the workload intensity:
- Large-scale training (100B+ parameters): H100/H200/B200 SXM with NVLink. Maximum power but maximum throughput.
- Medium training and fine-tuning: A100 80GB or H100 PCIe. Lower power, still capable for most training tasks.
- Batch inference: MIG-enabled GPUs (H100 partitioned into 7 instances) to maximize inference throughput per watt.
- Real-time inference: L4, L40S, or RTX 4090 at 72-450W TDP. Much lower power per inference query than using an H100.
5. Leverage Time-of-Use Electricity Rates
Where available, time-of-use (TOU) rate structures offer lower electricity prices during off-peak hours. Training workloads are deadline-insensitive and can be scheduled to run primarily during off-peak periods. In markets with TOU pricing, shifting 60% of training compute to off-peak hours can reduce electricity costs by 15-25%.
6. Cooling Technology Selection
The table earlier showed that cooling technology choice affects total power cost by 30-60%. For a 256-GPU cluster consuming 230 kW of IT power at $0.055/kWh:
- Air cooling at PUE 1.5: $6,960/month overhead for cooling
- Liquid cooling at PUE 1.08: $1,114/month overhead for cooling
- Savings: $5,846/month or $70,152/year
At this scale, the capital cost of liquid cooling infrastructure (approximately $500-$800 per kW of capacity) pays for itself within 18-24 months purely through electricity savings. Our cooling technology comparison covers the full spectrum of options and their trade-offs.
Capacity Planning: Sizing Power for Growth
GPU power consumption is increasing faster than GPU performance per watt. Planning for future power needs requires understanding the trajectory:
| Generation | Per-GPU TDP | 8-GPU Server (est.) | Year |
|---|---|---|---|
| A100 SXM | 400W | ~5 kW | 2020 |
| H100 SXM | 700W | ~7.5 kW | 2022 |
| H200 SXM | 700W | ~7.5 kW | 2024 |
| B200 SXM | 1000W | ~11 kW | 2025 |
| GB200 NVL72 (per tray) | 1200W | ~14 kW | 2025 |
If you are signing a 3-5 year colocation contract today, plan for per-rack power requirements to double over the contract period. A facility that supports 30 kW per rack today will be inadequate for the next generation of GPU servers. Choose a colocation partner that can deliver 50-100+ kW per rack with liquid cooling infrastructure already in place. Our rack density planning guide covers how to future-proof your deployment.
Power Monitoring and Management
Accurate power measurement is the foundation of cost optimization. You cannot optimize what you do not measure.
- GPU-level: NVIDIA nvidia-smi reports real-time GPU power draw. Integrate with monitoring stacks (Prometheus + Grafana) for historical trending and anomaly detection.
- Server-level: BMC/IPMI sensors report total server input power. More accurate than summing component estimates because it captures PSU losses and components not individually monitored.
- Rack-level: Intelligent PDUs (Raritan, ServerTech, APC) measure per-outlet and aggregate rack power with 1% accuracy. Essential for capacity planning and billing reconciliation.
- Facility-level: DCIM systems aggregate rack, cooling, and facility power for PUE calculation and capacity management.
Set up automated alerts for power anomalies: a GPU drawing significantly less than expected may indicate a failed GPU (still consuming idle power but not contributing compute). A server drawing more than TDP may indicate a cooling problem (fans running at maximum, GPU thermal throttling triggering repeated boost/throttle cycles).
Optimize Your GPU Infrastructure Costs
Rax operates liquid-cooled GPU colocation facilities in the UAE with competitive power rates and high-density rack support. Get a detailed power and cost analysis for your specific GPU deployment.
Request Power Assessment