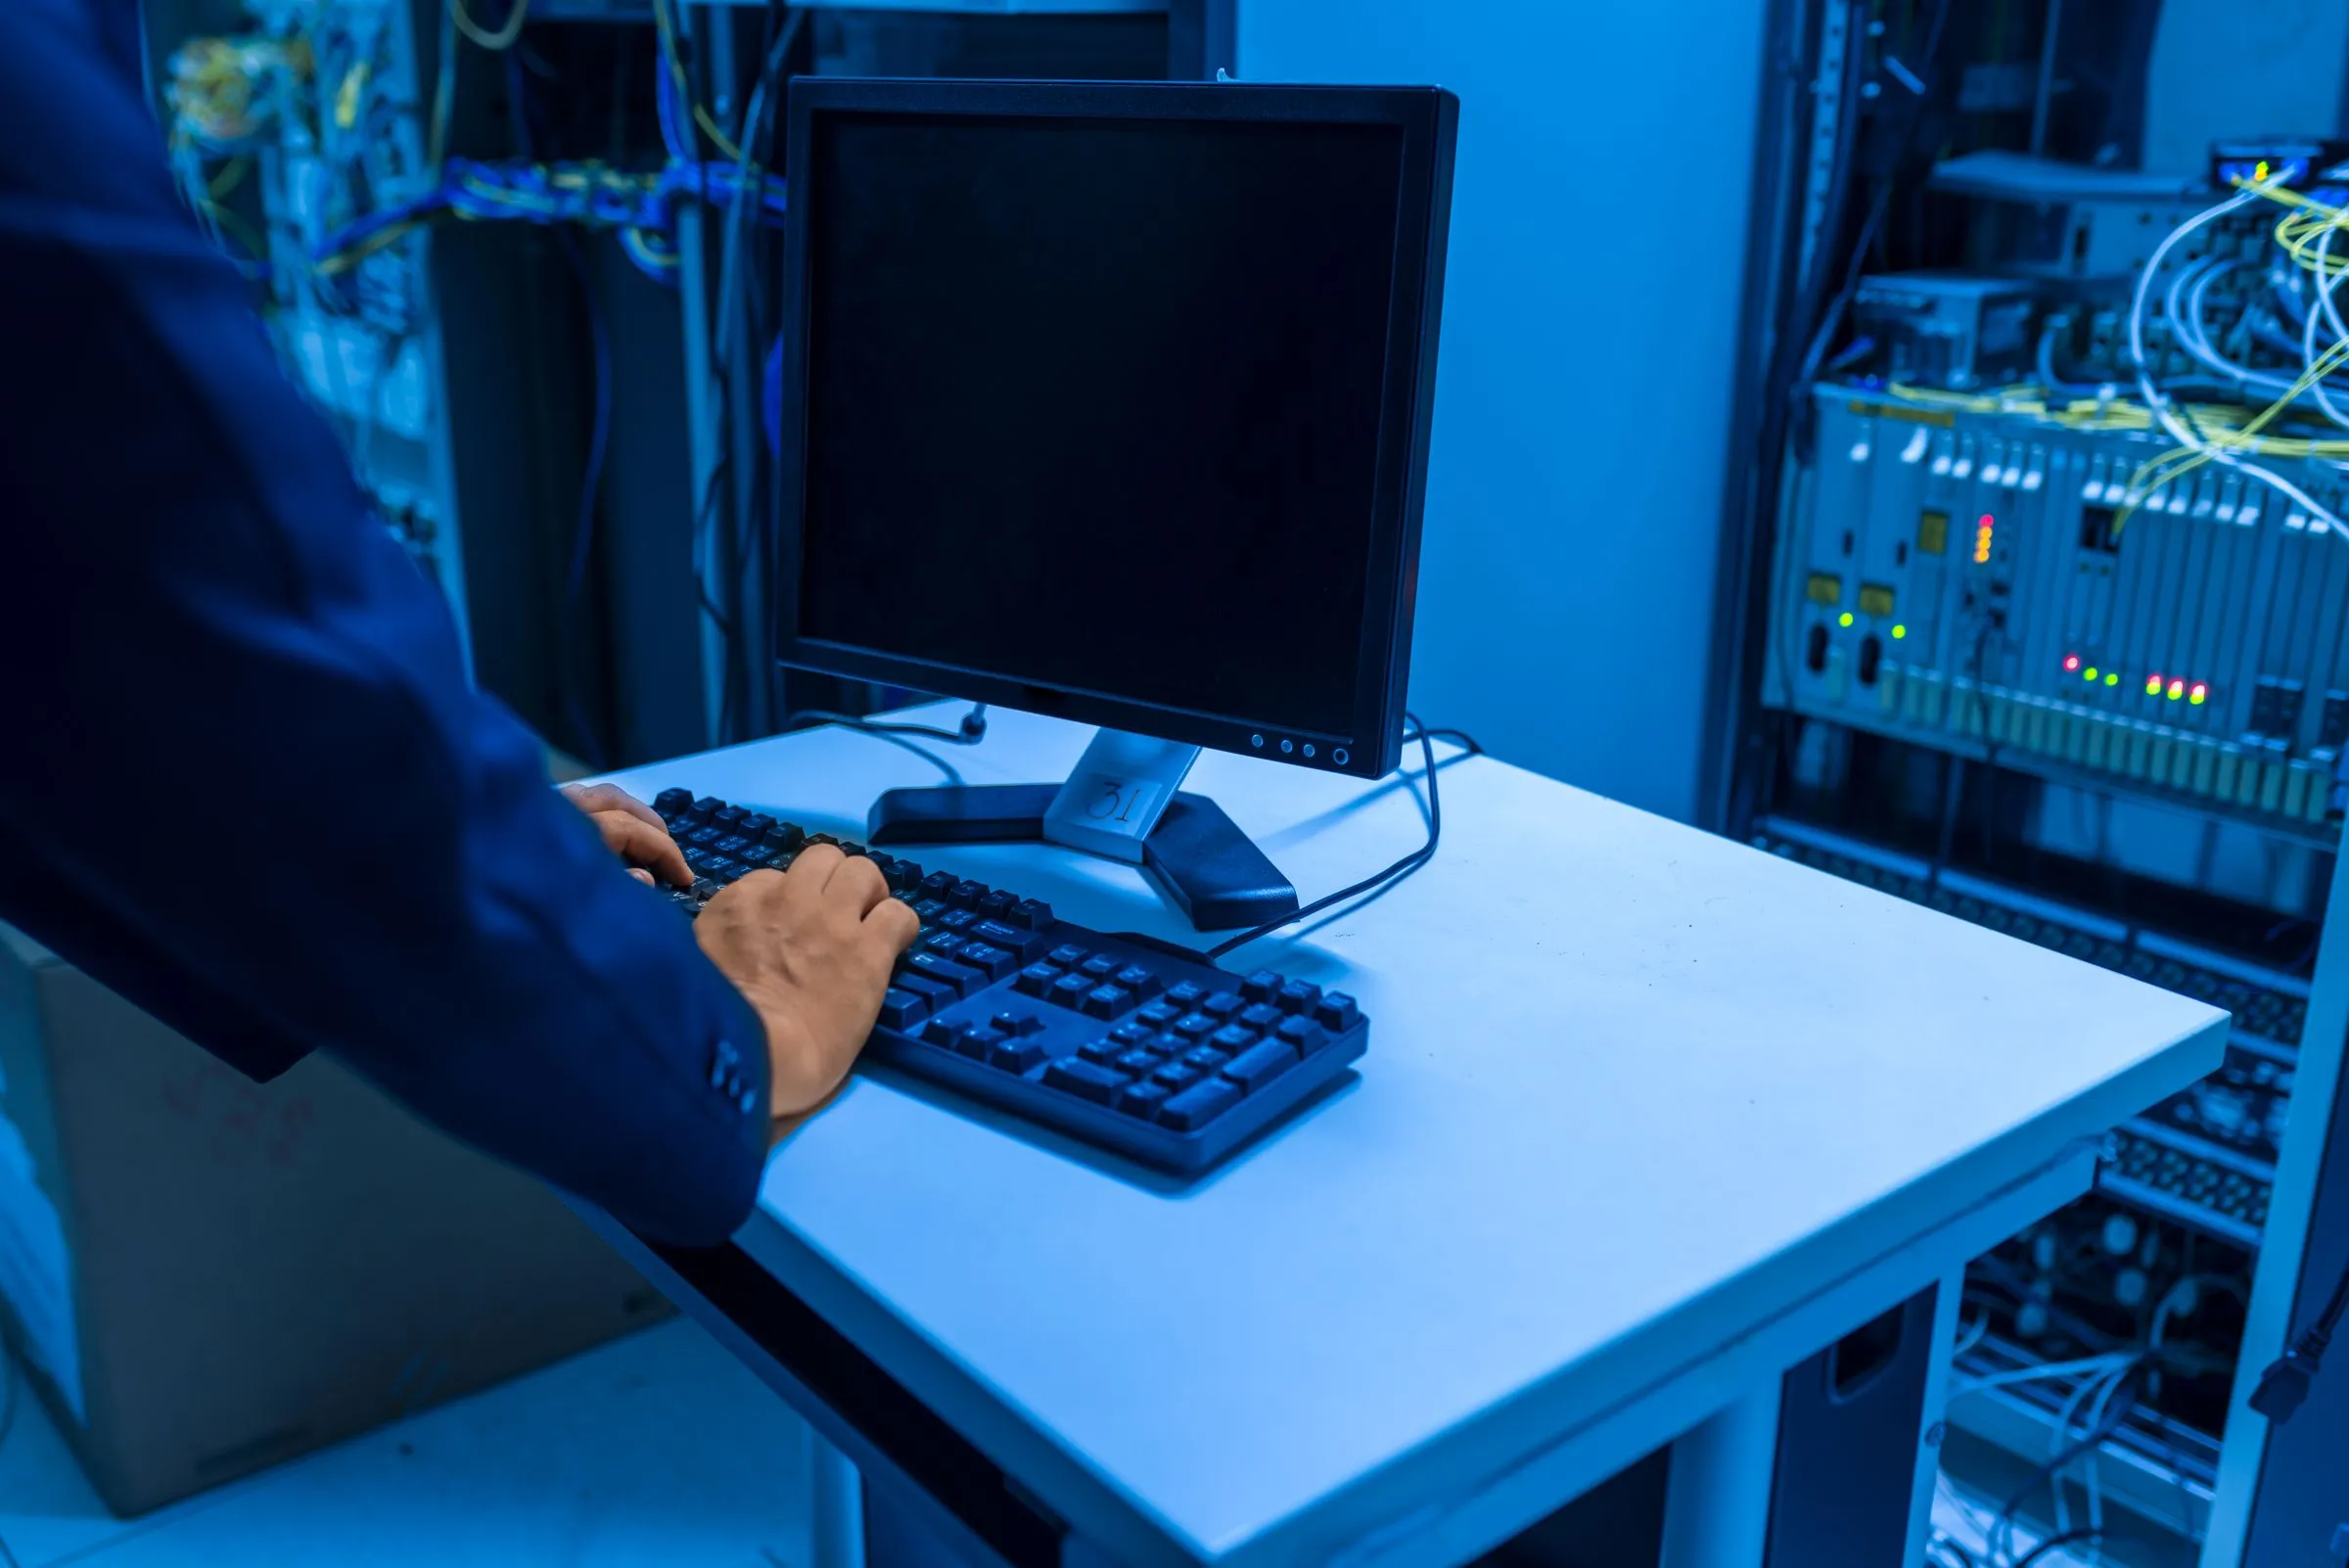
The Observability Gap in GPU Data Centers
Most data center operators have mature monitoring for traditional infrastructure: server CPU and memory, storage IOPS, network bandwidth, power draw, and cooling temperatures. But GPU-intensive AI facilities introduce an entirely new telemetry dimension that existing tools were never designed to handle.
A single NVIDIA H100 GPU exposes over 150 telemetry metrics through NVIDIA's Data Center GPU Manager (DCGM). Multiply that across a 1,000-GPU cluster and the monitoring system must ingest, store, and correlate 150,000 GPU-specific data points at intervals of 1 to 10 seconds. Add facility-layer telemetry from power distribution, cooling systems, and network fabric, and the total telemetry volume can exceed 500,000 metrics per second.
The challenge is not just volume. It is correlation. When a distributed training job running across 256 GPUs experiences a 12% throughput degradation, the root cause could be a single GPU with rising ECC errors, a congested InfiniBand switch port, a CDU that has drifted 2 degrees above its setpoint, or a software-layer issue in the training framework. Without integrated observability that connects GPU-level metrics to network, power, and cooling telemetry, operators resort to manual investigation that can take hours, during which expensive GPU time is wasted.
The Four Layers of GPU Infrastructure Telemetry
Effective observability requires systematic telemetry collection at four distinct layers, with correlation logic that connects them.
Layer 1: GPU and Accelerator Telemetry
The GPU itself is the most granular telemetry source and the most direct indicator of workload health. Key metrics fall into several categories:
Thermal metrics. GPU junction temperature, memory temperature, and the delta between inlet coolant temperature and GPU temperature. Trending analysis on these metrics reveals thermal interface material degradation, fan or pump performance decline, and workload-driven thermal patterns. For liquid-cooled GPU deployments, the coolant-to-junction delta is particularly informative: a rising delta at constant workload indicates degrading thermal transfer efficiency.
Memory health. ECC error counters are the single most important predictive indicator for GPU hardware failure. Correctable ECC errors (single-bit errors that the hardware fixes transparently) are normal in small quantities. But a trending increase in correctable errors, especially concentrated in specific memory pages, is a strong predictor of imminent uncorrectable errors that will crash the GPU process. Fleet-wide analysis shows that GPUs exhibiting more than 100 correctable ECC errors per day have a 37% probability of experiencing an uncorrectable error within 30 days.
Utilization and performance. Streaming multiprocessor (SM) utilization, memory bandwidth utilization, tensor core activity, and PCIe/NVLink throughput. These metrics establish the performance baseline against which anomalies are detected. A training workload that normally sustains 92% SM utilization dropping to 78% without any code change signals an infrastructure-layer issue.
Power consumption. Per-GPU power draw compared against the TDP envelope. GPUs that consistently draw 5% to 10% more power than fleet average at identical workloads may have silicon quality issues that lead to higher thermal output and shorter lifespan. Conversely, GPUs drawing significantly less power may be thermal-throttling without explicit throttle events being logged.
Layer 2: Node and Server Telemetry
The server hosting the GPUs provides context that GPU-only telemetry cannot. Key metrics include:
- CPU utilization and system memory: AI training workloads are typically GPU-bound, but data preprocessing, checkpoint writes, and gradient synchronization use CPU and system RAM. CPU bottlenecks during data loading create GPU idle bubbles that appear as utilization drops at the GPU layer.
- Storage I/O: Local NVMe drives used for checkpoint storage, data staging, and swap. Drive health metrics (SMART data, wear leveling counts, reallocated sector counts) feed into predictive maintenance models.
- Network interface counters: Per-port TX/RX bytes, error counts, and retransmit rates for both the data network (InfiniBand or RoCEv2) and the management network (Ethernet).
- BMC and IPMI telemetry: Baseboard management controller data including inlet air temperature, fan speeds, voltage rails, and hardware event logs.
Layer 3: Network Fabric Telemetry
The GPU interconnect fabric is the nervous system of an AI training cluster. Fabric health directly determines training performance, and fabric failures can be more disruptive than individual GPU failures because they affect communication across the entire cluster.
Switch-level metrics. Port utilization, buffer occupancy, congestion notification counters (ECN marks for RoCEv2, BECN for InfiniBand), CRC error rates, and link flap events. InfiniBand switches expose these through the Subnet Manager and can be polled via the OpenSM perfquery tool or vendor-specific APIs.
Flow-level visibility. Aggregate port statistics can mask per-flow imbalances. A port showing 60% average utilization might have one flow saturated at 95% while others idle. Flow-level telemetry using sFlow, IPFIX, or vendor-specific sampling reveals these imbalances and identifies communication hotspots in the training topology.
Critical metric: InfiniBand symbol error rate exceeding 10^-12 on any link warrants investigation. Rates exceeding 10^-10 require immediate cable or transceiver replacement. At 400 Gbps NDR line rates, even a 10^-11 symbol error rate generates hundreds of correctable errors per second, degrading effective throughput by 3% to 5% through retransmissions.
Layer 4: Facility Infrastructure Telemetry
The facility layer connects GPU performance to the physical environment. This is where traditional DCIM meets AI-specific requirements.
Power telemetry. Per-rack power draw from intelligent PDUs, phase balance across the three-phase supply, UPS charge level and battery health, generator fuel level and readiness status, and utility feed voltage and frequency. For GPU facilities drawing 40 to 100+ kW per rack, per-circuit monitoring at the PDU breaker level is essential to prevent overload conditions as GPU power draw fluctuates with workload.
Cooling telemetry. CDU inlet and outlet coolant temperatures, flow rates, pump pressure differentials, chiller plant operating parameters, and for immersion-cooled deployments, dielectric fluid levels and temperature distributions. The most actionable metric is the approach temperature: the difference between the cooling system setpoint and the actual coolant supply temperature. A widening approach temperature indicates declining cooling capacity before it affects GPU temperatures.
Environmental sensors. Temperature and humidity at multiple points per rack row, water leak detection under raised floors and around cooling distribution plumbing, particulate monitoring in air-cooled zones, and smoke detection. In the UAE's climate, ambient temperature monitoring at building intake points provides early warning of extreme heat events that may require proactive load shedding.
Building the Observability Stack
The technology stack for GPU cluster observability typically includes four components: collection, transport, storage, and visualization/alerting.
Collection
GPU telemetry: NVIDIA DCGM is the standard collection agent for NVIDIA GPUs, exposing metrics through a Prometheus endpoint, gRPC API, or direct integration with monitoring tools. DCGM runs as a daemon on each GPU node and collects metrics at configurable intervals (1 second is typical for production monitoring, 100 milliseconds for debugging). For AMD Instinct GPUs, ROCm SMI provides equivalent telemetry.
Server telemetry: Node Exporter (Prometheus ecosystem) or Telegraf (InfluxDB ecosystem) for OS-level metrics. Redfish/IPMI exporters for BMC-level hardware telemetry. Custom exporters for vendor-specific hardware like NVSwitch and DGX BasePOD management controllers.
Network telemetry: UFM (Unified Fabric Manager) for InfiniBand fabrics, providing both real-time telemetry and historical analytics. For Ethernet-based RoCEv2 fabrics, SNMP polling or streaming telemetry (gNMI) from switches. sFlow or IPFIX for flow-level visibility.
Facility telemetry: BACnet or Modbus gateways for mechanical and electrical systems (CRAC units, CDUs, generators, UPS). Intelligent PDU APIs for per-outlet power monitoring. Environmental sensor networks communicating via SNMP or MQTT.
Transport and Storage
At the scale of GPU clusters (hundreds of thousands of metrics per second), the telemetry pipeline must be designed for throughput and retention.
Time-series databases are the standard storage backend. InfluxDB, Prometheus with Thanos or Cortex for long-term storage, VictoriaMetrics, and TimescaleDB are all proven at GPU cluster scale. Storage sizing should plan for 2 to 5 bytes per metric sample at 10-second resolution, with 90-day hot retention and 1-year cold retention. A 1,000-GPU cluster generates approximately 50 to 100 GB of telemetry data per day at 10-second resolution.
Message queues (Apache Kafka or NATS) between collectors and storage provide buffering during ingestion spikes and enable multiple consumers (alerting engines, analytics pipelines, compliance systems) to process the same telemetry stream independently.
Visualization and Alerting
Grafana is the dominant visualization platform for GPU infrastructure, with purpose-built dashboards for DCGM metrics, fabric health, and facility systems. The key to effective GPU dashboards is hierarchical drill-down: a top-level view showing cluster health, with the ability to drill into specific racks, nodes, and individual GPUs.
Alert design for GPU clusters requires careful threshold calibration. Static thresholds (alert when GPU temperature exceeds 83 degrees C) generate excessive noise because baseline temperatures vary across GPU models, cooling configurations, and workload types. Anomaly-based alerting that compares current metrics against a rolling baseline for each specific GPU is more effective.
Alert fatigue is real: A poorly tuned monitoring system for a 1,000-GPU cluster can generate hundreds of alerts per day, desensitizing operators and causing genuine critical alerts to be missed. Start with a minimal alert set (uncorrectable ECC errors, thermal shutdowns, power circuit overloads, cooling failures) and expand incrementally based on operational experience.
Predictive Maintenance with GPU Telemetry
The highest-value application of GPU observability is predicting hardware failures before they occur. Unplanned GPU failures during training runs are expensive: they can invalidate hours of compute if the training framework lacks fault tolerance, and even with checkpointing, recovery takes time and engineering attention.
Failure Signature Analysis
GPU failures follow recognizable telemetry signatures that precede the failure event by hours to days:
- Memory degradation: Correctable ECC error rate increasing from baseline (typically under 10 per day) to 50 to 100+ per day, often concentrated in specific memory pages. This pattern precedes uncorrectable ECC errors by 7 to 30 days in most cases.
- Thermal interface degradation: Junction temperature rising 3 to 5 degrees C above fleet average at identical workload and ambient conditions, developing over weeks.
- Interconnect degradation: PCIe or NVLink CRC error rates increasing from zero to sporadic, then consistent. Often caused by cable or connector oxidation, vibration-induced loosening, or transceiver end-of-life.
- Power delivery issues: Voltage rail fluctuations or power consumption spikes that do not correlate with workload changes. Can indicate VRM degradation on the GPU board or server power supply issues.
Machine Learning for Failure Prediction
Fleet-scale telemetry data (thousands of GPUs over months of operation) provides sufficient training data for machine learning models that predict failures. The state of the art in 2026 uses transformer-based models that analyze multivariate time-series telemetry and output a failure probability score for each GPU.
Published results from hyperscale operators show 96% or higher prediction accuracy with 48 to 72 hours of advance warning. This lead time is sufficient to schedule a maintenance window, migrate workloads to healthy nodes, and replace the failing GPU without impacting training schedules. For colocation operators managing customer GPU hardware, predictive maintenance transforms the service model from reactive break-fix to proactive fleet management.
FinOps and Utilization Monitoring
Observability serves financial optimization as much as operational health. GPU infrastructure represents the largest capital expense in AI data centers, and underutilization is a direct drag on ROI.
Utilization Accounting
GPU utilization monitoring must distinguish between allocation and actual use. A GPU allocated to a customer or workload but sitting idle still consumes power (typically 50 to 80 W at idle for an H100, compared to 350 to 700 W under load) and occupies a slot that could serve revenue-generating work.
Key utilization metrics for financial optimization:
- Allocated utilization: Percentage of GPU inventory assigned to active workloads or customers. Target: above 90% for colocation, above 85% for internal clusters.
- Active utilization: Percentage of allocated GPUs actually executing compute (SM utilization above 10%). The gap between allocated and active utilization represents "zombie workloads": allocated but idle resources.
- Effective utilization: Average SM and memory utilization across active GPUs. For training workloads, effective utilization above 80% is good. Below 60% suggests workload tuning opportunities.
Automated Zombie Workload Detection
Zombie workloads, which are GPU allocations with near-zero utilization for extended periods, are a significant source of waste. An automated detection system should flag any GPU allocation with less than 5% SM utilization sustained over 2 hours, notify the workload owner, and automatically release the allocation if no response is received within the policy window.
For a 1,000-GPU facility charging $3.00 per GPU-hour, reclaiming 20% zombie utilization recovers $5.25 million in annualized GPU-hour value. Even if only half of those reclaimed hours are resold, the financial impact is substantial.
Integrating DCIM with GPU Observability
The gap between Data Center Infrastructure Management (DCIM) systems and GPU monitoring platforms is the single largest blind spot in most AI data center operations. DCIM tracks power, cooling, and space. GPU monitoring tracks compute health. Neither system, operating alone, can answer questions like: "Is this training slowdown caused by a GPU issue or a cooling anomaly?"
Integration Architecture
Bridging the gap requires a correlation layer that maps GPU telemetry to facility telemetry using physical location as the common key. Every GPU metric must be tagged with its physical location (site, building, room, row, rack, rack unit), and facility metrics must use the same location taxonomy.
Modern approaches use a unified telemetry data lake that ingests both GPU and facility metrics into a common storage backend with a shared tagging schema. This enables cross-layer queries, correlation analysis, and composite dashboards that show the complete picture from the GPU die to the utility meter.
Implementation Roadmap
Building full-stack observability is a multi-phase effort. A practical roadmap for GPU facility operators:
| Phase | Timeline | Deliverables | Cost |
|---|---|---|---|
| Phase 1: Foundation | Weeks 1-4 | DCGM deployment, Prometheus/Grafana stack, basic GPU dashboards, critical alerts | $50K-$100K |
| Phase 2: Fabric + Facility | Weeks 5-10 | Network telemetry integration, facility DCIM feeds, cross-layer dashboards | $100K-$200K |
| Phase 3: Analytics | Weeks 11-18 | Predictive maintenance models, utilization analytics, FinOps dashboards | $150K-$300K |
| Phase 4: Automation | Weeks 19-26 | Automated cross-layer responses, zombie workload detection, self-healing | $100K-$200K |
Total investment for a 1,000-GPU facility: $400,000 to $800,000, which represents less than 1% of the GPU hardware value and typically pays for itself within the first year through improved utilization and reduced unplanned downtime.
Frequently Asked Questions
What metrics should be monitored for GPU cluster health in an AI data center?
Comprehensive monitoring spans four layers. GPU level: temperature, power draw, SM clock, memory utilization, ECC errors, PCIe/NVLink throughput. Node level: CPU, system memory, storage I/O, network counters. Fabric level: InfiniBand or RoCEv2 port errors, congestion notifications, link flaps, per-flow bandwidth. Facility level: rack power, coolant temperatures, CDU flow rates, ambient conditions. Correlating across layers is essential for root-cause analysis.
How does predictive maintenance work for GPU hardware in data centers?
Predictive maintenance uses historical telemetry to identify failure signatures before they cause downtime. Key indicators include trending correctable ECC errors, rising junction temperatures at constant workload, increasing PCIe or NVLink CRC errors, and power consumption deviations. Transformer-based ML models analyzing fleet-wide telemetry achieve 96% or higher failure prediction accuracy with 48 to 72 hours of advance warning, enabling proactive maintenance scheduling.
What is the difference between GPU monitoring and full-stack data center observability?
GPU monitoring tracks accelerator health and workload performance using tools like NVIDIA DCGM and Prometheus. Full-stack observability extends this to power systems, cooling, network fabric, storage, and the physical environment. Integrated observability spanning all layers enables rapid root-cause analysis and reduces mean time to resolution from hours to minutes.
See Our Monitoring-First Approach to GPU Hosting
Rax Data and Energy operates GPU hosting facilities with integrated observability from chip to chiller. Learn how our monitoring infrastructure protects your AI workloads.
Contact Us Our Infrastructure