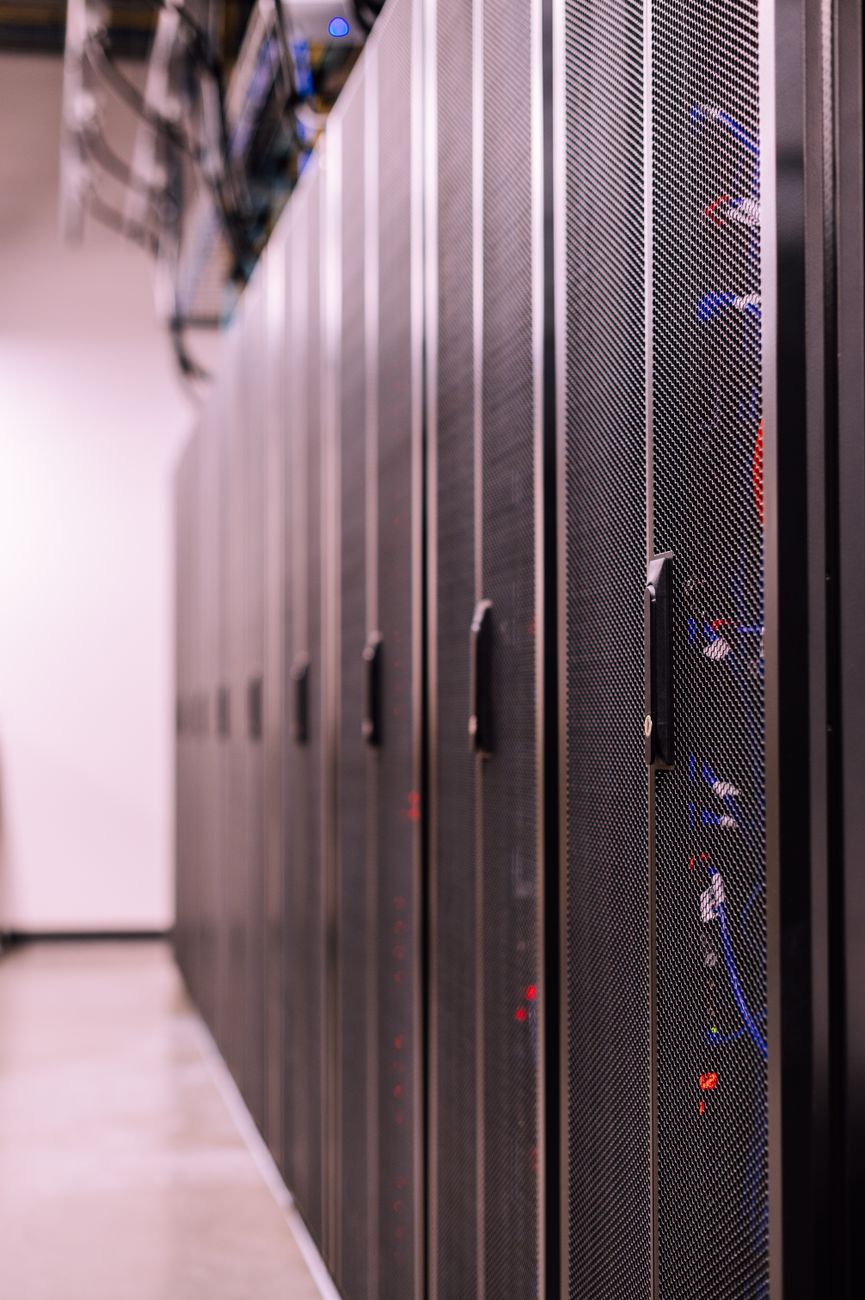
Why Power Budgeting Matters More for AI Than Traditional IT
Traditional enterprise workloads draw modest, predictable power. A standard server rack in a corporate data center might consume 5 to 10 kW. The margin for error is forgiving because the absolute numbers are small and the variation between idle and peak is narrow.
AI workloads break this model. A single rack of eight NVIDIA H100 SXM GPUs draws 40 to 50 kW under sustained training loads. Next-generation systems like the NVIDIA GB200 NVL72 can exceed 100 kW per rack. At these densities, a 10 percent budgeting error on a 20-rack deployment means 80 to 100 kW of stranded power capacity (wasted capital) or 80 to 100 kW of missing headroom (growth ceiling). Getting the power budget right is one of the highest-leverage decisions in any AI infrastructure buildout.
Nameplate Power vs. Actual Draw
Every GPU has a Thermal Design Power (TDP) rating, sometimes called nameplate power. This is the maximum sustained power the processor is designed to draw. Budgeting at full TDP across every GPU in every rack, 24 hours a day, is the most common source of overprovisioning in AI colocation.
The Reality of GPU Power Profiles
AI workloads do not run at constant 100 percent utilization. Different workload types produce different power profiles:
- Large-model training. Sustained high utilization with periodic dips during checkpointing, data loading, and gradient synchronization. Typical average draw: 85 to 95 percent of TDP. This is the closest any workload comes to sustaining nameplate power, but even here, the average is below the peak.
- Inference serving. Highly variable depending on request volume. Batch inference during off-peak hours may average 30 to 50 percent of TDP. Real-time inference with fluctuating traffic typically averages 40 to 70 percent. Only sustained peak-traffic periods approach 80 percent or higher.
- Fine-tuning and experimentation. Bursty pattern with periods of high utilization during runs and idle periods between experiments. Average utilization often falls below 60 percent of TDP when measured across a full week.
Understanding these profiles is the difference between contracting for the right amount of power and paying for capacity that sits unused. For deeper analysis of GPU power characteristics, see our guide to GPU server power consumption.
Power Budget Components
A complete power budget for GPU colocation accounts for more than just the GPUs. Every component in the rack draws power, and overlooking ancillary loads leads to underprovisioning at the rack level even when GPU power is correctly estimated.
Component-Level Breakdown
| Component | Typical Power per Rack | Notes |
|---|---|---|
| GPUs (8x H100 SXM) | 5,600 W (8 x 700W TDP) | Dominant load; actual draw varies by workload |
| Host CPUs (2x per node) | 600 - 1,200 W | Higher for data preprocessing workloads |
| System memory (DDR5) | 200 - 600 W | Scales with capacity; 1-2 TB typical for AI nodes |
| NVMe storage | 100 - 400 W | Depends on number and type of drives |
| Networking (NICs, switches) | 200 - 800 W | InfiniBand switches and 400GbE NICs add up |
| Fans, BMC, miscellaneous | 100 - 300 W | Often overlooked; adds 2-5% overhead |
| PSU efficiency loss | 3 - 8% of total | 80 Plus Titanium loses ~3%; Gold loses ~8% |
For a fully loaded 8x H100 SXM node, total wall power typically falls in the 10 to 12 kW range. A rack holding four such nodes draws 40 to 50 kW at sustained training load. Understanding high-density colocation power requirements at this granularity prevents surprises when the PDU readings come in.
Measure, do not estimate. Before signing a colocation contract, run your actual workloads on the target hardware and measure wall power at the PDU. Even a one-week benchmark on a small cluster provides far more accurate budgeting data than any spreadsheet model based on TDP ratings.
Budgeting Methodology: A Practical Framework
The following framework balances accuracy against the reality that most organizations cannot perfectly predict their workload mix 12 to 36 months into a colocation contract.
Step 1: Profile Your Workload Mix
Classify your planned GPU utilization into workload categories. For each category, estimate the percentage of total GPU-hours it will consume:
- Large-model training (sustained high utilization)
- Fine-tuning and experimentation (bursty)
- Real-time inference serving (variable, traffic-dependent)
- Batch inference and offline processing (schedulable)
- Development and testing (low utilization)
Step 2: Apply Workload-Specific Power Factors
For each workload category, apply a power factor as a percentage of GPU TDP:
- Training: 90 percent of TDP (sustained, near-peak)
- Fine-tuning: 75 percent of TDP (bursty average)
- Real-time inference: 60 percent of TDP (traffic-weighted average)
- Batch inference: 50 percent of TDP (schedulable, often off-peak)
- Dev/test: 30 percent of TDP (intermittent)
Step 3: Calculate Weighted Average Power
Multiply each workload's power factor by its share of GPU-hours, then sum. For example, a deployment that is 40 percent training, 20 percent fine-tuning, 25 percent inference, 10 percent batch, and 5 percent dev/test yields a weighted average of approximately 72 percent of TDP.
Step 4: Add Headroom
Apply a 15 to 20 percent headroom margin above the weighted average for growth, workload mix shifts, and transient power spikes. This is substantially less than the 50 to 100 percent margins traditional IT deployments carry, because GPU workload power profiles are better characterized and more predictable once measured.
Step 5: Size the Contract
The resulting figure, weighted average plus headroom, is your target contracted power per rack. For the example above using H100 SXM nodes: 72 percent of 50 kW peak plus 18 percent headroom equals approximately 42 kW per rack contracted. Compare this to 50 kW if you budgeted at full TDP. The 8 kW per rack savings, multiplied across 20 racks, represents 160 kW of avoided cost. At typical colocation power pricing, that savings is significant over a multi-year term.
Common Budgeting Mistakes
Overprovisioning: The Hidden Tax
Many organizations budget at 100 percent TDP plus 30 to 50 percent margin because they are accustomed to enterprise IT budgeting practices where power is cheap relative to compute. In GPU colocation, power is the dominant cost. Overprovisioning by 30 percent on a 1 MW deployment means paying for 300 kW of capacity that generates no revenue. Over a three-year contract, that unused capacity can cost hundreds of thousands of dollars in committed power charges alone.
Underprovisioning: The Growth Ceiling
The opposite error is equally dangerous. Organizations that budget too tightly discover they cannot add GPUs when demand grows. In colocation, expanding power allocation often requires a contract amendment, additional circuits, or even moving to a different hall or facility. If the facility is constrained, expansion may not be available at all. Budget for where you will be in 18 to 24 months, not just where you are today.
Ignoring the Cooling Load
Power delivered to IT equipment becomes heat that must be removed. In traditional facilities, the Power Usage Effectiveness (PUE) overhead adds 30 to 80 percent to the IT load for cooling and facility power. In modern, purpose-built AI facilities with liquid cooling, PUE can be as low as 1.1 to 1.2, meaning only 10 to 20 percent overhead. Understanding your colocation provider's PUE and how cooling costs are allocated, whether bundled into the power rate or charged separately, materially affects total cost.
Power Density and Rack Placement
Not all colocation space is created equal. Legacy facilities designed for 5 to 10 kW per rack cannot support 40 to 100+ kW AI racks without significant electrical and cooling upgrades. When evaluating colocation providers, verify the following for each rack position:
- Circuit capacity. Each rack needs dedicated circuits sized for peak draw plus margin. A 50 kW rack on single-phase 208V requires over 240 amps per feed, which exceeds standard whip capacity. Three-phase power at 415V is standard for high-density AI racks.
- PDU rating. The power distribution units in the rack must be rated for the total load. Standard 30A PDUs are inadequate for AI racks; look for 60A or higher-rated units. More on PDU selection and configuration.
- Redundancy configuration. Determine whether the colocation provider offers N+1 or 2N power redundancy at your target density. Some facilities can only provide 2N redundancy at lower densities, meaning half the power capacity goes to the redundant feed.
- Cooling capacity per rack. The facility must remove heat at the same rate it delivers power. A rack drawing 50 kW produces 50 kW of heat. Verify the cooling infrastructure at each rack position can handle your target density, whether through rear-door heat exchangers, overhead cooling, in-row units, or direct liquid cooling.
Rax Data & Energy designs its colocation infrastructure for the power densities that modern AI workloads demand, including liquid cooling support and high-amperage power distribution. For density-specific requirements, our pricing page outlines available configurations.
Contract Considerations
Power budgeting does not stop at the technical calculation. The colocation contract determines how you pay for power and what flexibility you have to adjust.
- Committed vs. metered power. Most AI colocation contracts include a committed power allocation (you pay for it whether you use it or not) plus metered overage charges. Right-sizing the committed allocation using the methodology above minimizes waste while maintaining headroom.
- Power ramp schedules. If you are deploying GPUs in phases, negotiate a ramp schedule that aligns committed power with deployment milestones. Paying for 500 kW on day one when you are deploying 100 kW of equipment in the first quarter erodes ROI.
- Burst capacity. Some providers offer burst or flex power that allows temporary exceedance of committed allocations during peak periods. This can be more cost-effective than committing to peak power year-round for workloads with known cyclical patterns.
Frequently Asked Questions
How much power does an AI GPU rack consume?
Power consumption per rack varies by GPU model and configuration. A rack of eight NVIDIA H100 SXM GPUs typically draws 40 to 50 kW including networking and host CPUs. Next-generation systems like the NVIDIA GB200 NVL72 can draw 100 to 120 kW per rack. Legacy CPU-only enterprise racks draw 5 to 15 kW for comparison.
What is the difference between nameplate power and actual power draw?
Nameplate (TDP) power is the maximum sustained power a GPU is designed to draw. Actual power depends on the workload. AI training typically sustains 85 to 95 percent of TDP. Inference workloads often average 40 to 70 percent. Budgeting at nameplate for training and 70 to 80 percent for inference is a reasonable starting point before you have measured data.
How do I avoid overprovisioning power for GPU colocation?
Run representative workloads on target hardware and measure wall power at the PDU. Factor in realistic utilization patterns rather than assuming 100 percent GPU load. Reserve 15 to 20 percent headroom above measured peak for growth and transients, rather than the 50 to 100 percent margins common in traditional enterprise deployments.
Right-Size Your AI Power Budget
Rax Data & Energy provides high-density GPU colocation with flexible power configurations, liquid cooling, and transparent per-kW pricing designed for AI workloads.
Get a Quote View Pricing